Case Study
Share this
article
Beam
/ Column Moment Connection Research
-
Geometric
and material nonlinear analysis of moment-resisting connections
-
Slideline
surface modelling of contacting members
-
Excellent
correlation of experimental testing results
Jon K. Lindsey with HNTB
(Kansas City) used LUSAS Civil & Structural to carry out
Ph.D. research on alternative moment-resisting
connection arrangements. The aim was to make design recommendations
that will allow a structural designer to push the limits of the
material and connection configuration further and increase the
economy of steel moment-resisting frames. By using nonlinear solid
modelling with slideline surface contact excellent correlation was
achieved between the results predicted by LUSAS and measurements
obtained from experimental testing conducted at the University of
Kansas.
Overview
Several different configurations of
one particular type of moment-resisting connection - the extended
end-plate moment connection - are being researched. These
connections typically include wide-flange steel shape sizes and are
intended for use in multi-storey structures in moderate to high
seismic zones. Both exterior (one-sided) and interior (two-sided,
cruciform) connections, are undergoing assessment with varying
levels of local column reinforcement to investigate weak-column /
strong-beam behavior in steel, moment-resisting frame construction.
The connection specimens consist of a
W21 beam member with a 1" thick welded end-plate and a W14
column member which is stiffened by a 1/2" column stiffener
(continuity plate) that extends either full-depth of half-depth
across the column web. The beam and column sections are bolted
together with 1.25" diameter bolts. The specimens are loaded
with a displacement-controlled load history to examine the stress
and yield in both members. Steel properties for the connections were
obtained from coupon tests and subsequently used to define nonlinear
material attributes in the LUSAS finite element modelling.
|
|
 |
|
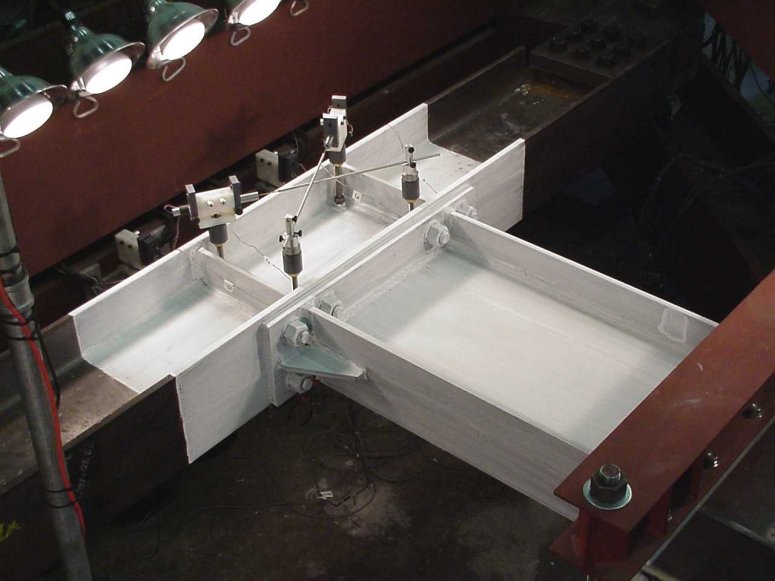
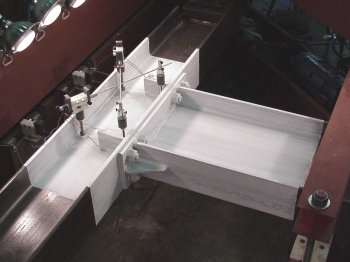
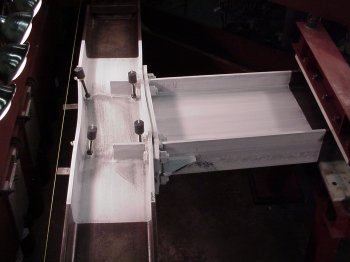
Exterior
connection with half-depth column web stiffeners at start of
test |
Exterior connection with
half-depth column web stiffeners at end of test |
Modelling
LUSAS was chosen for this research
project because of the geometric nonlinear and material nonlinear
capabilities it offers for this type of work. Hexahedral 8-noded
solid isoparametric elements with enhanced strains modelled the
steel members and endplates and 3D thick nonlinear beam elements
were used to model the end- plate bolts. Quadrilateral 4-noded thick
shell elements represented the steel members away from the area of
interest. This modelling approach allows a high concentration of 3D
elements to be used where needed and correctly models the actual
lengths of each member to allow for the replication of the actual
testing system end-constraints and the application of the applied
displacement. In all, around 8000 elements modelled each beam and
column connection. The aim of the modelling was to correlate the
experimental data and to do so it was essential, due to the nature
of the extended end-plate moment connection under investigation,
that the column and beam components could deform independently of
one another to capture the true behavior of the connection
interface. Correct modelling of the column flanges and contacting
end plates is the key to analyses of this type. To accurately model
each connection and mimic the applied experimental loading each
LUSAS model incorporated slideline surfaces to represent the
contacting members. LUSAS slidelines automatically take care of any
frictional contact between contacting components and allow complex
problems involving contact and friction to be modelled and analysed
with relative ease.
Loading and
Supports
Loading was applied using
displacement-controlled loadcurves - a means of loading each
connection model by applying a predefined increasing displacement to
the end of the beam member. These displacement parameters were based
on prescribed inter-storey drift increments. The single-cycle
loadcurve was proportioned such that the model would experience
"significant" yielding at the peak displacements of the
cycle. Model support conditions replicated those of the experimental
testing apparatus.
Results
From the 3D solid, material and
geometric nonlinear loadcurve analysis. the first yield cycle (where
significant yielding is exhibited), as observed and recorded in the
experimental testing, was recreated exactly in the LUSAS analysis.
Jon K. Lindsey, Structural Engineer
at HNTB (Kansas City) said: "The LUSAS analysis matched the
experimental results very, very closely and was much better than I
expected. This was primarily due to using accurate material data
obtained by material testing to define the elasto/plastic material
model for LUSAS to use, and also due to having defined all the model
geometry - the fillet welds, the weld-access holes, fillets of
wide-flange sections, the clips on stiffeners, etc. exactly as per
the test models." He continues: "The LUSAS slideline
facility was especially useful to me for this work as, also, was the
ability to quickly modify the LUSAS model for the different
connection types required. Using LUSAS I could graph nearly any
aspect of the results against any other aspect and create
high-quality charts, contour plots and animations not just for �eye
candy�, but as learning tools and to gain valuable insight into
the structural behaviour."
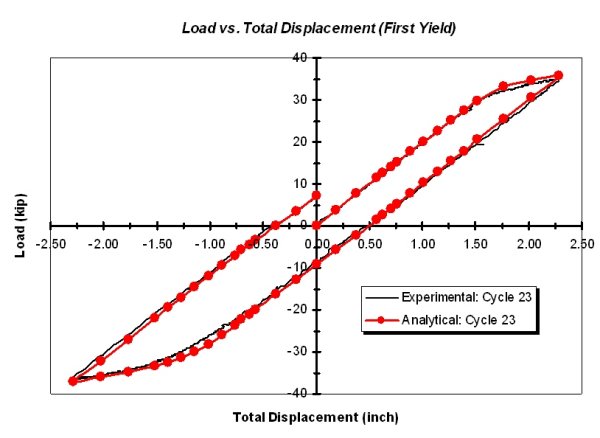
Stress time histories were plotted to
chart the formation of stress concentration zones and areas of yield
could be easily seen. Load versus total displacement and time
history data was graphed to record the correlation of the
experimental results.
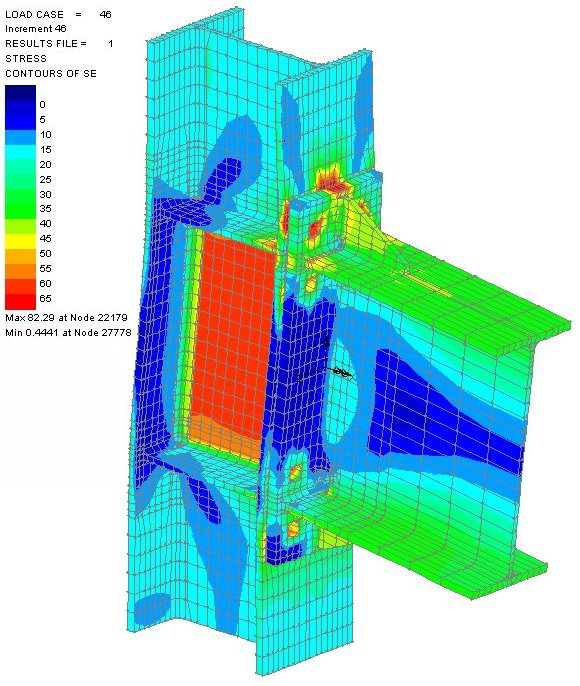 |
| Stresses
in exterior connection with full-depth column web stiffeners |
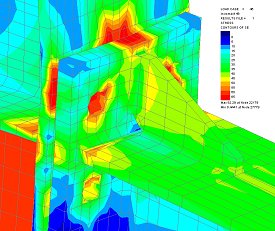 |
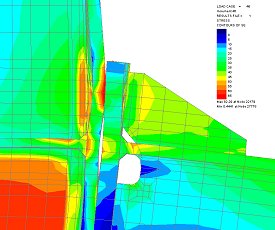 |
| Enlarged
view of stresses in exterior connection |
Side
view showing end-plate separation |
Recommendations
and Future Work
As a result of this work it is
intended that design recommendations will be given to allow
structural designers to push the limits of the material and
connection configuration further and increase the economy of the
steel moment-resisting frame. LUSAS will also be used on more
investigations of proposed configuration changes to conventional
column-side details.
"The LUSAS analysis
matched the experimental results very, very closely and was much
better than I expected. Using LUSAS I could graph nearly any aspect
of the results against any other aspect and create high-quality
charts, contour plots, and animations not just for "eye
candy" but as learning tools and to gain valuable insight into
the structural behaviour."
Jon K. Lindsey, HNTB (Kansas City)
Share this
article
Find out more
Other LUSAS Civil &
Structural case studies:
|