 Case
Study Case
Study
Slab
and Column Design for the Great Western Hospital, Swindon
TPS
Consult used LUSAS Civil & Structural for the
design and analysis of reinforced concrete floor slabs and columns
for the new Diagnostic and Treatment Centre at Great Western
Hospital in Swindon, UK. Static analysis using the reinforced
concrete slab/wall design utility provided reinforcement contour
plots for the slabs and also provided design moments and
horizontal shears for columns. Dynamic analysis permitted checking
of modal frequencies of vibration for slab elements against
allowable design code values.
Overview
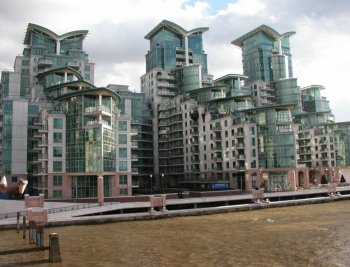
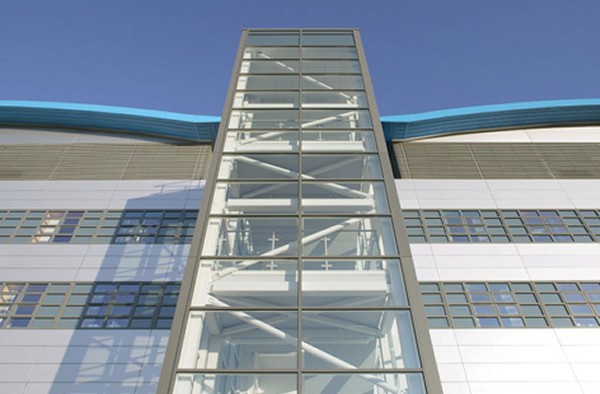
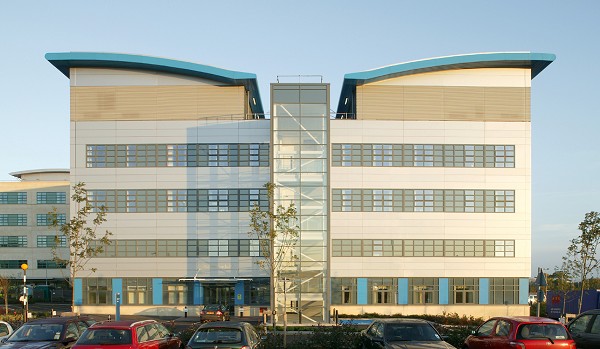
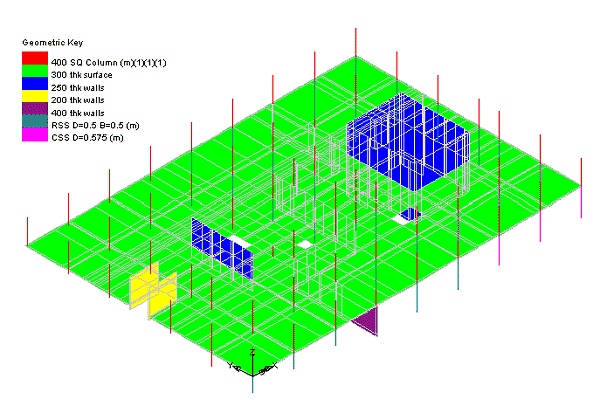
The Diagnostic and Treatment Centre
is a five storey building constructed on the existing Great
Western Hospital site for Carillion plc on behalf of Swindon
and Marlborough NHS Trust. It provides an additional 10,000 m2
of floor space and features a central courtyard at ground floor
level. The upper floor houses a plant room and water tanks, and is
covered by a lightweight steel roof superstructure. Floors are
300mm thick flat slabs with dominant openings based on a 7.2m x 7.2m
grid.
Modelling
To optimise the time
available for analysis and results processing each floor was
modelled as a separate subframe with thick beam and thick shell
elements representing the columns and slabs/walls respectively. In
addition to moment continuity at the interface between slab and
supporting elements, the remote ends of columns and walls were
typically fixed in translation and rotation, with the upper ends
freed in the vertical direction.
Loading
In addition to the self
weight, partition loads of 1kN/m2, services loads of
1kN/m2 and live loads of 3kN/m2 had to be
modelled. The top floor, on which plant rooms are present, required
a 7.5 kN/m2 live load, with a supplement of 15 kN/m2
in two locations where water tanks are located. A single loadcase
of 1.4 dead load plus 1.6 live load with all spans fully loaded was
adequate for the typical floors, according to UK design code BS
8110:1997. The plant room floor slab however, with its relatively
high live load meant that, for this, loading of alternate spans had
to be modelled. Full and empty water tanks were also modelled.
Column and wall design
As the subframe model
consisted of only two storeys, a sensitivity study was conducted by
freeing the bases in rotation. This had the effect of concentrating
the moments at the slab interface and provided an element of
conservatism in the analysis. LUSAS analysis data for the columns
was then compared with calculated values. Each column was considered
in turn and the most onerous values were used for the detailed
design. Walls were designed separately assuming eccentricity moments
resulting from the slab interface.
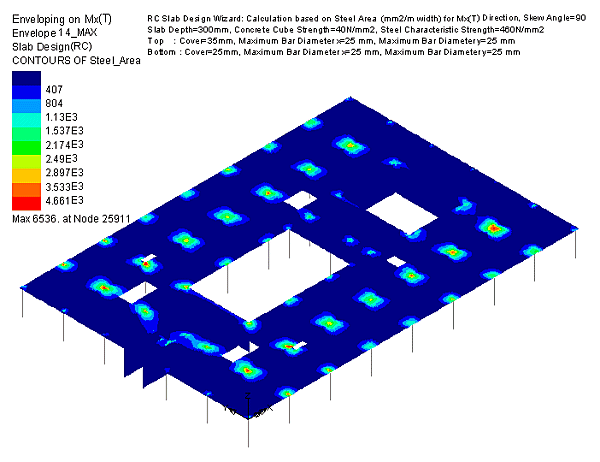
Slab reinforcement
contour plots
Using LUSAS, Wood Armer reinforcement
contour plots were produced for each floor. Contour levels were
adjusted to reflect combinations of 12, 16, 20 and 25mm bars with a
10% increase to account for bars being cut when drilling for
services installation. Appropriate redistribution was applied to the
contour plots to reflect actual concrete behaviour under loading.
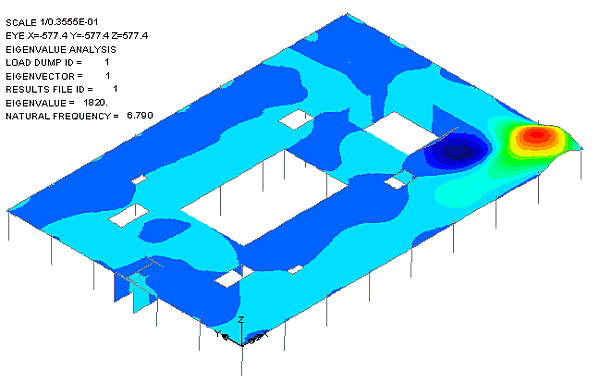
Modal analysis
With minimum additional
effort a modal analysis was performed and highlighted the locations
where dynamic effects would be the most adverse. Alistair Mugford,
project engineer at TPS Consult explains: "We did this by
adding a mass equivalent to the load per unit area and then ran a
standard eigenvalue analysis to obtain the natural frequencies which
we compared with the appropriate limits for each floor".
Conservative vibration frequency limits were obtained from published
data – 8Hz for operational floors and 5Hz for the plant room
floor. The natural frequencies for the building exceeded the
vibration limits in every case – proving the design to be
satisfactory.
"LUSAS provided us with an extensive set of
results which we could use for
designing to the appropriate code of practice"
Alistair Mugford, Project Engineer, TPS Consult
Find out more
Other LUSAS Civil &
Structural case studies:
|