Software Tour
Viewing results
LUSAS Bridge has a host
of easy to use results processing and viewing facilities to help you
get the most from your analysis.
- Select loadcases
individually for each view window, and display multiple views of
the model, with each window showing results for different
loadcases.
- Manually specify
basic load combinations, defining loadcases to be included and
load factors to be used.
- Use Smart
Combinations to generate maximum and minimum results, taking
account of adverse and relieving effects, substantially reducing
the number of combinations and envelopes required.
- Define envelopes of
multiple loadcases to provide maximum and minimum results.
- Use design-code based
combinations to assess ULS or SLS combinations.
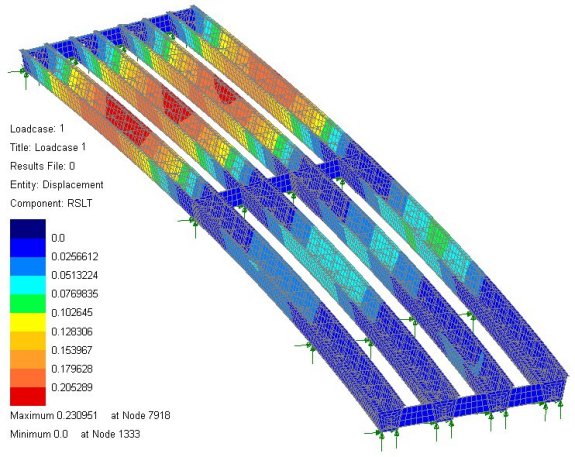
- Plot bending moment
and shear force diagrams and visualise structural deflections.
- Control contour
ranges and vector/diagram scales individually for each view
window, or set globally to apply to all view windows.
- Display results in
global or local directions, in element directions, or at any
specified orientation.
- Plot results on
deformed or undeformed mesh plots and on fleshed or unfleshed beam
sections.
- Cut multiple slices
through 3D solid models on arbitrary planes and make them visible
or invisible in any window.
- Selectively output
results to spreadsheet applications for additional calculation and
graphing uses.
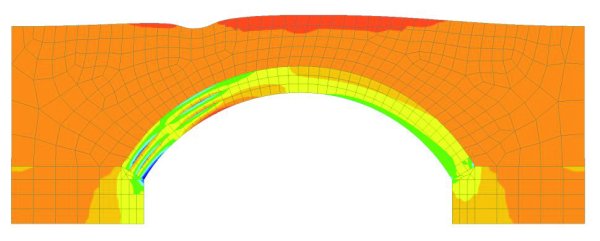
- For concrete
modelling, plot crack width contours, crack patterns and values
for supported design codes.
- Use inspection locations
to obtain results for user-defined positions of
interest on a model.
User defined results
calculator
Use the in-built �spreadsheet-style�
user-defined results calculation facility to include LUSAS model and
results parameters in arithmetic expressions to create user-defined
results components. Unlike external spreadsheet calculations, because
all calculations are done inside LUSAS and based upon current model
and results data, the values obtained can be automatically be
recalculated at the press of a button if the model data is edited, or
if results change.
After
definition, the user results components created can be selected by
name from the Component drop-down list on the Contours, Values, and
Diagrams layers properties dialogs. All standard LUSAS results
processing, viewing, animating, graphing, printing and report
capabilities can be used with any user-defined results components
Animations
Animate the
results - particularly useful for viewing mode shapes, assessing
structural response to moving loads and seismic events, and for
investigating the spread of concrete cracking or yielded material. Save
animations as AVI files for use in other Windows applications.
|
Graphing
Use the step-by-step
graph wizard to select results data to be drawn on a graph. Arbitrary
line sections may also be taken through any surface model or on a slice
cut through a three dimensional solid model.
|
|
Construction
tables
Produce
camber, displacement history, and incremental displacement results
tables for selected model locations to assist with staged construction
work.
Printed Results
Tabulate
results values for individual results components and entities using
the Print Results wizard. Transfer the data to other applications
using standard Windows copy and paste operations. Print model and
results views directly, or save as high resolution BMP, JPG, or WMF
files, or copy and paste direct into other applications.
|
Report generator
Create
one-click reports for selected members, and select general modelling,
loadcase and results data on an element, feature type, group, and
loadcase basis for inclusion in a main model report, Screenshots,
saved images, graphs and one-click reports can also be included.
Each time
a report is created, up-to-date modelling and results data is used to
ensure compatibility at all times.
Export
report data to Excel spreadsheets as well as into other
formats including PDF, HTML and RTF (for use in Word) for quality
assurance, model checking, and results listing purposes.
|
|
Output to
3rd Party Software
Save or copy the contents of a model
view window for use in
creating reports in applications such as MS Word. Export results for use in
spreadsheet applications such as MS Excel where additional graphing or calculations can be
carried out.
Software
customisation
Find out more
|
|
Software Information
|