 Case Study Case Study
Share this
article
Seismic analysis of viaduct substructures for the Dubai Metro light rail project
-
2D
and 3D modelling of concrete viaduct
structures
-
Seismic analysis to AASHTO LRFD
-
Pile and pier design moments obtained from seismic and modified BS
5400 load combinations
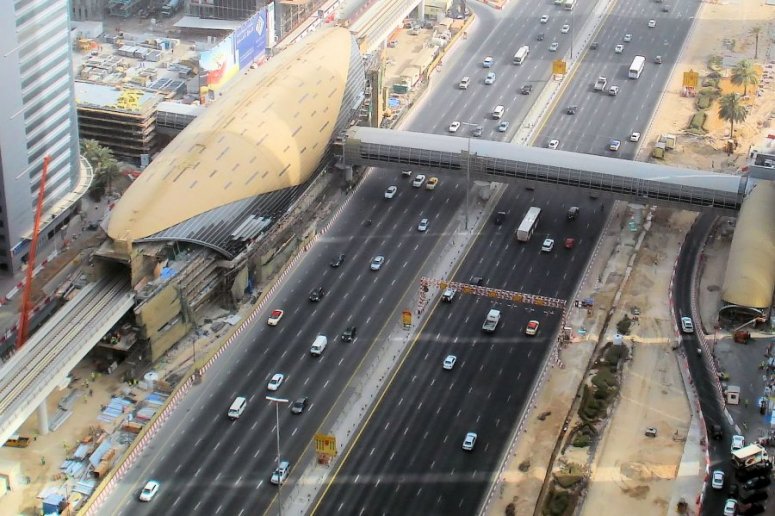
The Red and Green
Lines of the Dubai Metro light rail scheme are being constructed
as a Design-Build contract by a consortium of international
contractors. Atkins,
one of the world�s leading engineering and design
consultancies, is the lead designer to the major civil
contractor of the Dubai Rapid Link (DURL) Consortium and is
carrying out the full multi-disciplinary design and project
management of the civil works for the project. Atkins used LUSAS
Bridge analysis software to assist with its analysis and design
of various structures on the project including seismic analysis
of the viaduct substructures, where maximum bending moments were
derived for use in designing and reinforcing the pier and pile
sections.
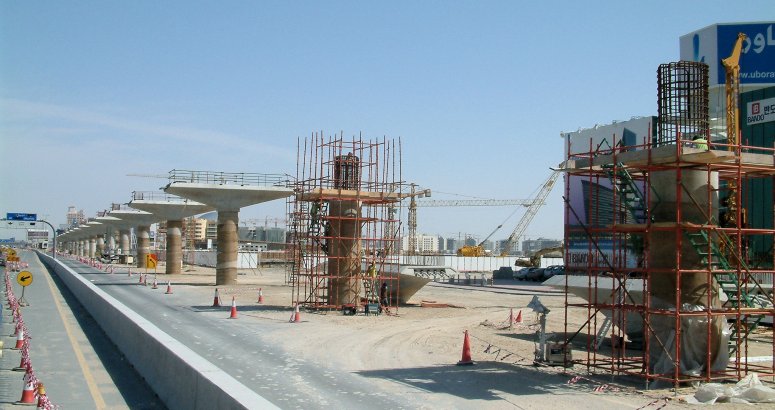
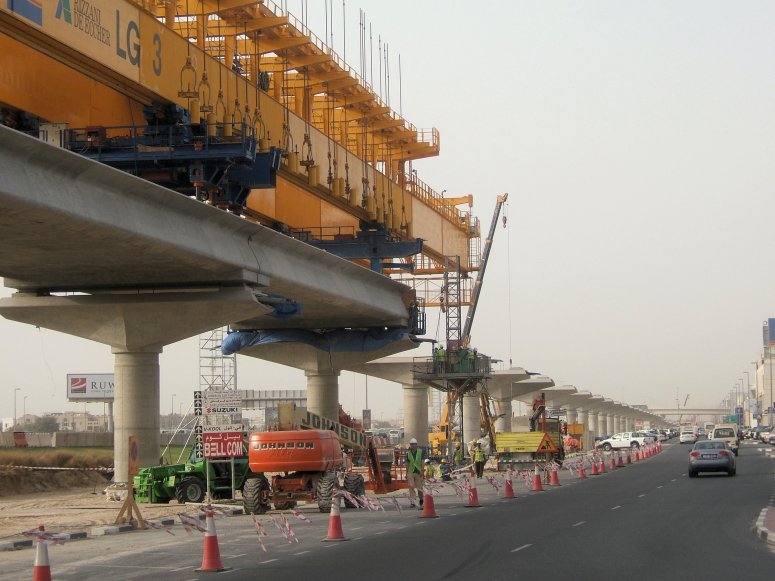
The
Red Line runs from Jebel Ali Port, through the city centre, to Al
Rashidiya - a distance of 52km in total. Of this length, some 42km is
of elevated viaduct construction. The Green Line runs from Al Qusais,
through the city centre, to Al Jaddaf - a distance of 24km. Of this length some 16km is of elevated
viaduct construction.
Overview
Viaducts on the Red and Green Lines
comprise a combination of simply supported single-span post-tensioned
precast decks of U-shaped cross-section supported on elastomeric
bearings, and two and three-span continuous decks on fixed and free
guided sliding pot bearings. Most viaduct spans are of a standard 28m,
32m or 36m length and are typically supported on single, circular,
reinforced concrete columns of 1.75m or 2m diameter. Flared pierheads
support the deck. For speed of construction most single piers are
supported on 2.2m and 2.4m diameter bored monopiles. Pierheads for the
single spans, twin spans and stations spans are of precast
construction (requiring in-situ concrete fill and prestressing).
Pierheads for single track and three-span continuous viaduct
structures are constructed solely in-situ and for these structures
large diameter bored piles were used. The majority of deck sections
are assembled by overhead gantries but, for the pier and pile design,
the temporary construction loading from the gantries was generally
found to be less onerous than that caused by any potential seismic
loading.
Design basis
The construction programme called for
the initial design of over 1200 unique foundations in the first nine
months of design to take the viaduct construction off the critical
path. Initially, to keep ahead of construction, this was done using
automation and conservative design methods but as time permitted more
refined calculations were introduced to optimise the design of
foundations yet to be constructed. Design of the viaducts was based on
BS 5400 and associated standards with the AASHTO LRFD Bridge Design
Specification being used for the seismic design. Using LUSAS Bridge,
both 2D and 3D modelling of sections of viaduct was carried out
according to span type.
Single-span modelling
Initially, 2D transverse and
longitudinal models were created in LUSAS to model the
simply-supported single-span structures. From these, natural
frequencies were obtained for the first 3 mode shapes for use with the
AASHTO LRFD design response spectrum in order to generate acceleration
values for the design of pile and pier sections. For the transverse
model, beam elements represented the piles, piers, and crossbeams.
Pile modelling was done using the equivalent cantilever method (as
opposed to modelling the soil/structure interaction as a beam with
elastic springs) with appropriate static and dynamic values provided
by Atkins geotechnical team. Elastomeric bearings were modelled with
joint elements of appropriate stiffness. In accordance with the Design
Basis Report the weight of a train acting on one track only was
represented by a joint element having a mass and vertical eccentricity
appropriate to the centroid of the train. Different pier heights
ranging from 2m to 20m and pier diameters of 1.75m and 2m were
investigated. Longitudinal models, built using similar modelling
techniques to the transverse model, evaluated a series of 36m long
viaduct spans. On these, beam elements also represented the deck
members and used an equivalent mass density to represent the actual
mass of the span as well as the additional mass of the superimposed
dead load.
| Continuous
span modelling
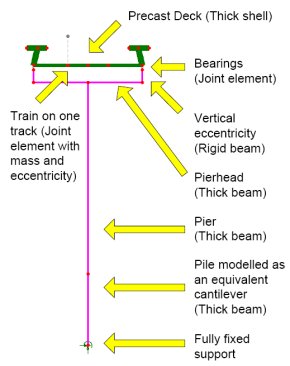
To analyse the dynamic behaviour
of numerous two and three-span continuous viaduct structures 3D
models were developed from the initial 2D transverse model and
used a very similar modelling methodology (see the image
right).
To allow for
torsional effects the deck was modelled using thick shell
elements. Whilst the deck profile varies in thickness along its
length, for modelling purposes an average thickness was
calculated for each part of the deck and mass density variations
along the span were used to ensure that the mass of the deck was
correctly distributed for the seismic assessment.
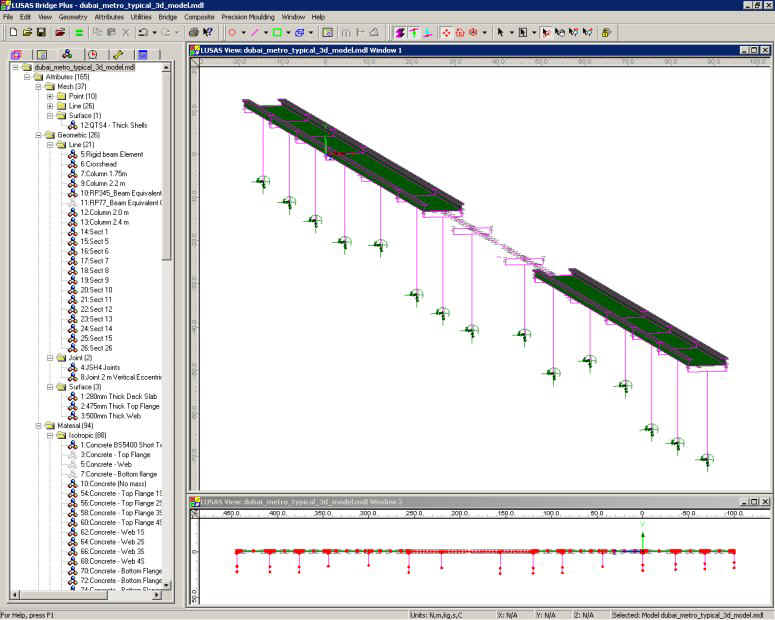
Three
simply-supported structures each side of the two or three-span
continuous structure were also included in each model to reduce
boundary effects, something additionally verified to be
conservative. |
|
|
3D modelling
concept (2D modelling similar) |
| |
|
|
|
3D modelling of a
multi-span continuous section of viaduct in LUSAS
(with three additional simply supported spans included each side
of the continuous structures) |
Seismic analysis
For each 3D model an eigenvalue
analysis produced the first 30 mode shapes. These were then checked to
ensure the percentage of mass excited in each direction was not less
than the 95% required by the AASHTO LRFD code. By using the LUSAS
Interactive Modal Dynamics (IMD) facility, and specifying a CQC
combination using the AASHTO response spectra and relevant damping
values, the maximum bending moments at the base of all piers for the
response spectra were obtained. Results from the IMD analysis were
ultimately combined with modified BS5400 load combinations to give
final design values. From these, pile and pier reinforcement was
designed and curtailed to suit specific force moment envelopes
generated for each support.
|
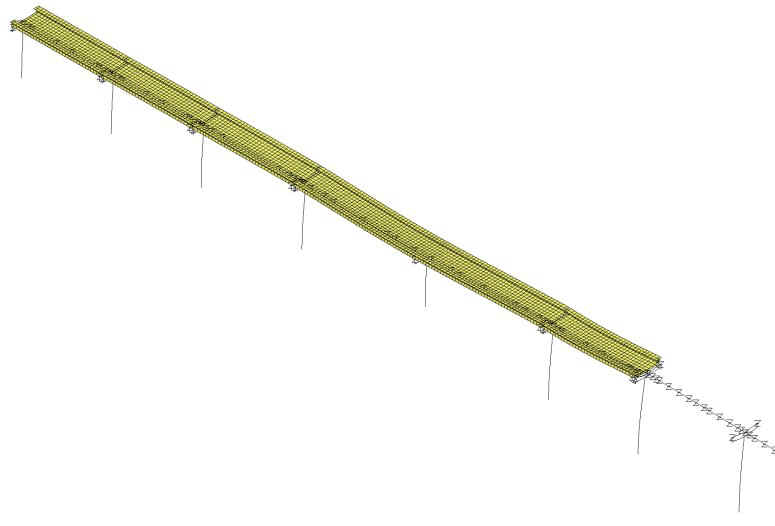
|
|
Typical deformed viaduct plot from a LUSAS Interactive Modal Dynamics analysis. |
Validation of results
LUSAS output was validated using
spreadsheet calculation via the SRSS method and also by an additional
equivalent static analysis. Manuela Chiarello, an engineer on the
project, explains: "For each model we saw how much each mode was
participating to the total response of the structure and ran an SRSS
analysis using a spreadsheet for just the dominant modes." She
continues: "After that we used the frequency of the dominant mode
and ran an equivalent static analysis using the corresponding
acceleration from the AASHTO response spectrum". Whilst these
methods should give close and conservative results respectively in
relation to the IMD results they served to help confirm results and
highlight any modelling anomalies.
David A Smith, Regional Head of Bridge
Engineering at Atkins said: "We had to solve several design and
programme challenges on this project to enable the viaduct
substructure and decks to be erected to an agreed construction
schedule." He continued: "Ultimately the use of precast
concrete elements for the deck and for key substructure components,
and the use of LUSAS software to assist with our design process, all
helped to ensure that the viaduct construction progressed as planned.
Official opening
The Red Line was officially opened on 9 September 2009 by His Highness Shaikh Mohammad Bin Rashid Al Maktoum, Vice-President and Prime Minister of the UAE and Ruler of Dubai. Ten key stations out of a total of 29 were opened to passengers initially, with the remaining stations being opened in batches over the following few months. All Red Line stations are set to be operational by February 2010. The Green Line is scheduled to be opened in June
2010.
Other analyses undertaken by Atkins on
the Dubai Metro light rail project using LUSAS include:
"The use of precast concrete
elements for the deck and for key substructure components, and the use
of LUSAS software to assist with our design process, all helped to
ensure that the viaduct construction progressed as planned."
David A Smith, Regional Head of Bridge
Engineering, Atkins
Share this
article
Find out more
Other LUSAS Bridge case studies:
|