 Case Study Case Study
Dynamic
Analysis of Newark Dyke Rail Bridge
- bowstring steel arch bridge for high-speed trains
- use of interactive modal dynamics techniques
- detailed dynamic analysis
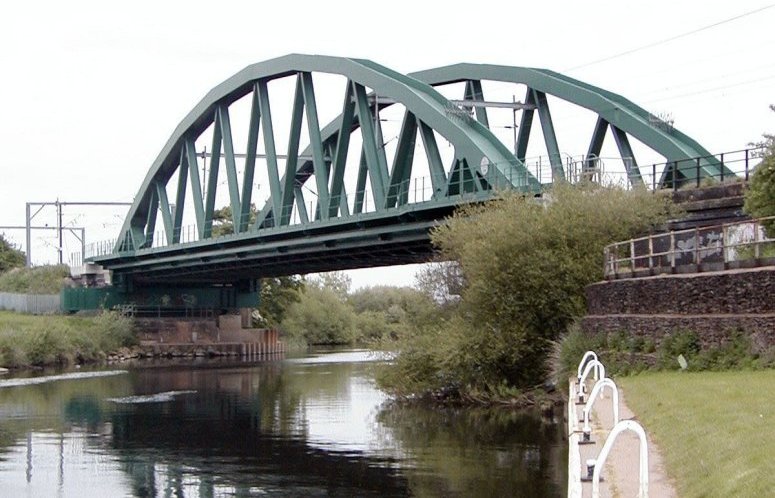
Newark Dyke bridge is a 77m long, 11.25m wide, steel bowstring arch
railway bridge designed for the next generation of 225 kph trains and, as such, is the
first of its kind in Britain. It carries the two tracks of the East Coast main line across
the River Trent at Newark in Nottinghamshire, and replaces two existing life-expired
structures. LUSAS Bridge analysis software was used by Cass Hayward & Partners to carry out
detailed dynamic analysis for their client Railtrack London North Eastern. The Interactive
Modal Dynamics (IMD) techniques used greatly reduced the time required to assess the
dynamic response of the structure for numerous combinations of different moving train
loads and speeds.
Requirements
The
client's specification called for dynamic analysis under loading from 12 different basic
train types, with variations in carriage makeup within some of the train types.
Three
high-speed trains were identified by Cass Hayward & Partners as likely to cause the
most critical dynamic effects. These comprised:
- Eurocode ENV 1991-3 Type 3,
- Class
373 Eurostar Capital Sets
- ECML GNER GEC Alsthom/FIAT 160mph tilting train
(Pendolino)
The main effects to be determined were the dynamic amplification of forces
and moments, and the vertical acceleration at the deck which must not exceed 0.35g in
order to prevent ballast instability under the track during the passage of trains. In
addition, sensitivity of the analysis to a choice of parameters such as structural
damping, stiffness and mass had to be investigated. In order to achieve this, a rapid
analysis procedure was required.
Modelling
The bridge was idealised in LUSAS as a stiffened shell deck structure
with beam and shell elements representing the deck. Beam elements modelled the bowstring
trusses. A single beam element was used for each bowstring truss member so that local
bending modes in the truss would not be identified in the analysis.
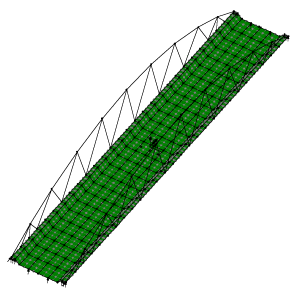
The dynamic assessment started with a
conventional eigenvalue analysis to obtain the response frequencies, eigenvectors, and
participation factors for the bridge structure. Modal force histories were created for a
single unit load axle passing over the bridge. For each train, loading profiles were
generated from the individual axle weights and then applied to create a composite modal
force history for the passage of a complete train. Using the LUSAS IMD facility a range of
train speeds from 150 to 288 kph in 3.6 kph (1m/s) intervals were analysed to derive the
peak dynamic response effect.
|
|
|
|
LUSAS model
|
Typical
eigenmodes |
Results
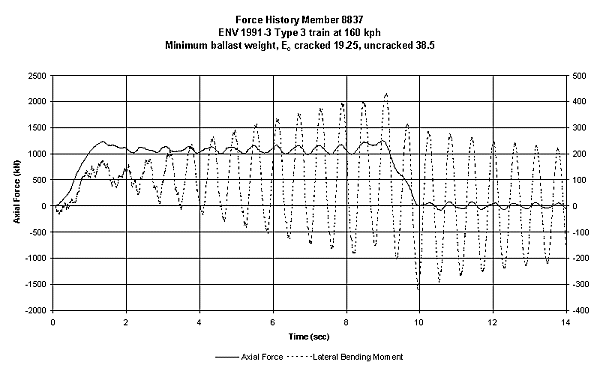
For the Newark Dyke bridge, the different train speeds were defined by
maintaining a consistent train motion across that bridge and simply adjusting the time
interval for the modal calculations. Such moving load calculations can process a range of
train speeds on each execution of the IMD facility. Results are readily obtained for
either a single train speed to give full time history output or for a range of train
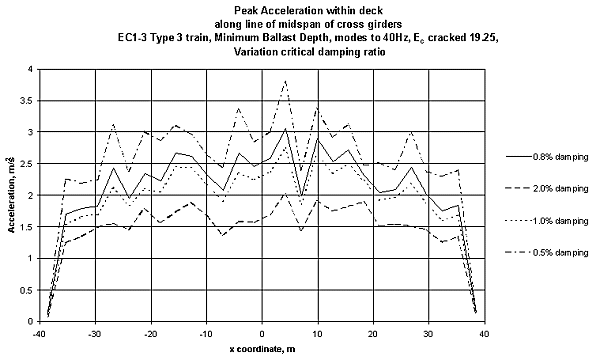
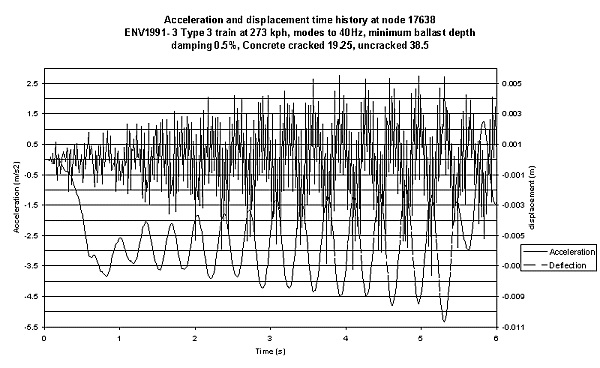
speeds to give peak response output only. Results were presented as graphs showing peak response against train speed at selected
points on the structure, and as time histories for specific train speeds. Comparison of
the results with the design criteria enabled Cass Hayward to complete their dynamic
assessment of the structure.
Representative graphs obtained are
shown below.
LUSAS Interactive
Modal Dynamics facility
The LUSAS IMD facility provides a way of rigorously analysing linear
dynamic response effects on a bridge or structure for a large number of possible train
crossing speeds or loading events, without the long analysis solution times associated
with traditional analysis methods. Forces, moments, displacements, response time
histories, and peak response summaries, both for the whole structure and at selected nodes
or elements can be obtained. Selected results can then be graphed, or standard contour,
vector, or peak value feature plots can be produced.
The assumption of linear structural behaviour enables
the IMD facility to make use of summation ("linear superposition")
techniques. As a direct result of this, IMD is of considerable benefit when compared with
traditional direct integration time-stepping procedures - in many cases results are
obtained in seconds as opposed to several hours. The IMD facility therefore offers large
savings in design and analysis time and greatly reduces the computational resources
required for lightly damped, linear transient dynamic analysis of this nature.
See Software Option - IMDplus Analysis
for more information.
Find out more
Other LUSAS Bridge case studies:
|