Bridge analysis, design + assessment

Case Study

Red Gate Pedestrian Bridge

  • Novel cable stayed pedestrian/cycle bridge suspended beneath road bridge

  • Detailed global modelling of bridge and local modeling of cable connection assembly

  • Pedestrian footfall analysis to ascertain maximum acceleration values for comparison with pedestrian comfort levels.

enesch provided Phase II engineering and Phase III construction management services for the project. - See more at: http://web.benesch.com/red-gate-road-bridge-named-public-works-project-of-the-year-pages-171.php#sthash.TosSj4Nq.dpuf

US consultant, Benesch, used LUSAS Bridge analysis software to assist with its design of a novel cable stayed pedestrian bridge that is suspended beneath the Red Gate Road Bridge that crosses the Fox River in the northern part of St Charles, Illinois. Load take-off and sensitivity analyses were carried out which, along with a staged erection analysis, helped to derive main beam camber values. Extreme loading events were assessed, and eigenvalue analysis and subsequent pedestrian footfall analysis indicated the structure could be susceptible to pedestrian induced vibration, resulting in the eventual installation of a tuned mass damper system.

Overview

Red Gate Bridge connects IL Route 31 and IL Route 25 across the Fox River in the northern part of St Charles - a western suburb of Chicago, Illinois. The two-lane road bridge, completed and opened to public in late 2012, supports an innovative cable-stayed pedestrian bridge from, and inside its concrete piers. The footbridge, which commenced construction once the piers has been built, but was completed later, was officially opened for public use in June 2013. It separates cyclists and pedestrians from the vehicular traffic and provides access to various forest preserves, park facilities and regional trails in the area.

The footbridge consists of four spans of 150’-0” (45.7m) and two anchor spans of 66’-3” (20.2m) each. The western anchor span and the adjacent span are curved with a radius of 575’ (175m). The steel superstructure consists of two main W24x104 (610mm deep x 324mm wide x 157kg/m) longitudinal stiffening 'I' beams, spaced 14’-6” (4.4m) apart, and W12x30 (315mm deep x 165mm wide x 45kg/m) transverse floor 'I' beams spaced at 7’-6” (1.47m) that are laterally braced. The 12’-10” (3.9m) wide deck is a 7” (178mm) thick non-composite-acting concrete slab, cast on stay-in-place corrugated metal decking, that spans between floor beams. Three cables, each attached to an upper and lower anchorage connection, support the ends of each longitudinal beam. Transverse beams at the cable connection locations are W24x62 (603mm deep x 178mm wide x 94kg/m) 'I' beams in order to resist the torsion created by the lateral inclination of the supporting cables. Cable anchorages at the piers are outside the plane of the main beams and the cables are laterally inclined by 8.5 degrees to the vertical plane. The piers themselves are skewed seven degrees to align with the flow of the river, meaning that careful detailing and positioning of the upper and lower anchorage plates was required.

Schematic section at pier.

Steel deck framing was erected prior to installation 
of road bridge beams

Modelling in LUSAS

LUSAS was used to assess the behaviour of the structure to meet the criteria of the 5th Edition 2010 AASHTO Bridge Design Specifications along with the 2009 AASHTO Guide Specifications for the design of pedestrian bridges. Analyses included self-weight, pedestrian live load, H10 vehicle loading, wind load, and unbalanced live loading due to extreme events such as eccentric pedestrian loading arrangements and cable breakages. A model of the complete footbridge was built using thick beam elements to represent the structural steel framing, bar elements for the cable stays, and thick shell elements to model the concrete deck. Support conditions varied to match those of the structure with abutments modelled with only a vertical reaction, piers 1, 3, and 5 having expansion bearings allowing longitudinal movement, and piers 2 and 4 using fixed bearings that allowed longitudinal movement. Once created, a load take-off was carried out in LUSAS to ascertain the maximum factored cable axial force, as well as the maximum service load. LRFD analysis and allowable strength design checks were both performed, so that the cables would meet both requirements. Static forces recommended by a wind study were included in the analysis model to incorporate the effects of wind on the structure. Modelling of the full erection sequence produced deck displacements that determined the 2-1/8" (54mm) pre-cambering value for the main beams.

LUSAS model showing cable arrangement at each pier and typical steelwork framing arrangement

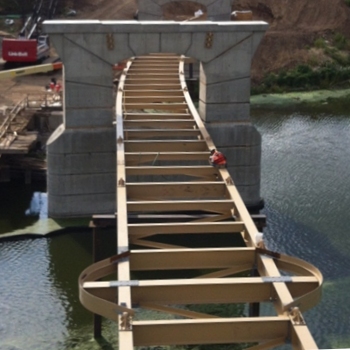
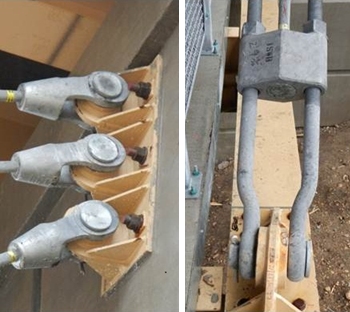
Upper and lower anchorage connections

Upper and lower anchorage connections are steel plated assemblies of various section thicknesses. For the upper connection the main objective was to avoid transmitting any tensile forces to the concrete pier so, to achieve this, six debonded 1” (25mm) diameter high-strength bars pass through the pier to the anchorage assembly on the other side to transfer the load as a compressive force on the anchorage plate on the adjacent side of the pier. Shear force is transferred to the pier via shear studs welded to the back of the mounting plate. A LUSAS model of an upper anchorage helped to verify the stresses and the forces in the debonded bars. The lower connection of the cables to the main girders uses an open bridge socket connected to an anchorage assembly bolted to the top flange of the girder.

Upper and lower cable connection details

LUSAS model of upper cable connection assembly


Sensitivity analyses and extreme loading assessments

A number of sensitivity analyses were performed with LUSAS to better understand the structure and the relative effect that certain variables had on the overall behaviour. These included looking at the connection fixity of the transverse floor beams; investigating the effect of modelling the true eccentricity of the girders relative to the deck and cable connection point on the overall behaviour of the model; and analysing the effect on the cables from using different vertical and horizontal modelling locations for the cable connections. For the latter, it was determined that modelling the pier connections as 3 separate points and modelling the correct horizontal distance between the cable anchorages, rather than joining them direct to each thick beam element representing the pier, was both more realistic, and provided more accurate results.

In addition to strength, serviceability and sensitivity checks, extreme loading events such as eccentric pedestrian loading and loss of cables were also assessed.

Real position modelling of cable connection locations

One span loaded with pedestrians with adjacent span empty. 

Eccentric pedestrian loading on one side of the deck.

Pedestrian footfall analysis

An eigenvalue analysis derived the key fundamental mode shapes and frequencies, and showed the first mode with a significant vertical mass participation had a frequency of 2.11 Hz. A dynamic analysis modelled the behaviour of the structure to various moving and pulsating pedestrian loads. Hossam Abdou, Vice President of Alfred Benesch and Company said: "Although the AASHTO Guide for Design of Pedestrian Bridges addresses the issue of vibration it appears to be geared more toward stiffer girder structures rather than slender and flexible cable structures. The Guide uses formulas that relate the weight of the structure to its natural frequency, however, it fails to address the size of the pedestrian traffic as it relates to the vibration induced and whether the resulting acceleration is within permitted limits for the traffic." Because of this the model was converted into SI units, appropriate Rayleigh damping parameters were specified to represent the damping behaviour of the materials / structure, and the LUSAS pedestrian load wizard was used to apply vertical oscillating pedestrian loading to the model in accordance with BS EN 1991-2 2003. This automatically created the numerous loadcases required to model the passage of the pedestrian groups across the structure.

Eigenmode used for footfall analysis

A plot of pedestrian load versus time and pedestrian load versus distance was automatically created by LUSAS, showing the sinusoidal load curve for the dynamic analysis. From this, a maximum vertical acceleration of 0.1728 m/s2 (1.76% g), and a maximum resultant acceleration of 0.1735 m/s2 were seen. The LUSAS analysis indicated that the maximum pedestrian level guidelines could be met but, as a precautionary measure, the deck framing had been laid out such that tuned mass dampers could be accommodated if they had been required. Subsequent field testing involving placing people on the completed structure indicated that uncomfortable vibrations might indeed be experienced and, as a result, the City of St. Charles ultimately decided to proceed with the installation of a damper system to increase pedestrian comfort.

Maximium acceleration time history for controlling node

Image courtesy of Trademan Photography (www.trademanphoto.com)

"Using LUSAS allowed us to accurately capture the behaviour of a very complex structure that included a curved and skewed alignment with cables that had both vertical and lateral inclinations."

Hossam Abdou, Vice President, Alfred Benesch and Company.


Find out more

LUSAS Bridge

Software products

Software selection


Other LUSAS Bridge case studies:


Software Information

  Bridge / Bridge plus
green_arrow.gif (94 bytes) Software overview
green_arrow.gif (94 bytes) Modelling in general
green_arrow.gif (94 bytes) Advanced elements, materials and solvers
green_arrow.gif (94 bytes) Load types and combinations
green_arrow.gif (94 bytes) Staged construction modelling
green_arrow.gif (94 bytes) Geotechnical / Soil-structure modelling
green_arrow.gif (94 bytes) Analysis and design
green_arrow.gif (94 bytes) Design code facilities
green_arrow.gif (94 bytes) Viewing results
green_arrow.gif (94 bytes) Software customisation

  Bridge LT
green_arrow.gif (94 bytes) Software overview

  Choosing software
green_arrow.gif (94 bytes) Software products
green_arrow.gif (94 bytes) LUSAS Bridge LT
green_arrow.gif (94 bytes) LUSAS Bridge
green_arrow.gif (94 bytes) LUSAS Bridge Plus
green_arrow.gif (94 bytes) Software selection
green_arrow.gif (94 bytes) Software options

green_arrow.gif (94 bytes) Videos
 
green_arrow.gif (94 bytes) Case studies

  Application areas
green_arrow.gif (94 bytes) Footbridge design
green_arrow.gif (94 bytes) Movable structures
green_arrow.gif (94 bytes) Rail solutions
green_arrow.gif (94 bytes) Arch bridges
green_arrow.gif (94 bytes) Major crossings
green_arrow.gif (94 bytes) Soil-Structure Interaction Modelling

  Additional information
green_arrow.gif (94 bytes) Linear and nonlinear buckling analysis
green_arrow.gif (94 bytes) Curved girder analysis
green_arrow.gif (94 bytes) Integral or jointless bridges
green_arrow.gif (94 bytes) Post-tensioning
green_arrow.gif (94 bytes) Concrete modelling
green_arrow.gif (94 bytes) Interactive Modal Dynamics
green_arrow.gif (94 bytes) LUSAS Programmable Interface (LPI)

  General information
green_arrow.gif (94 bytes) Hardware specification
green_arrow.gif (94 bytes) Licencing and Networking options
green_arrow.gif (94 bytes) Software prices
green_arrow.gif (94 bytes) Documentation
green_arrow.gif (94 bytes) Links page
 

Request information


innovative | flexible | trusted

LUSAS is a trademark and trading name of Finite Element Analysis Ltd. Copyright 1982 - 2022. Last modified: March 07, 2023 . Privacy policy. 
Any modelling, design and analysis capabilities described are dependent upon the LUSAS software product, version and option in use.