|
||||||||||||
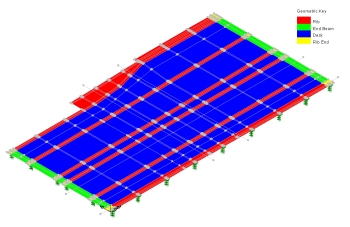
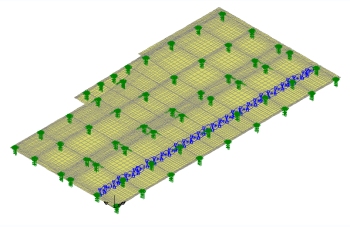
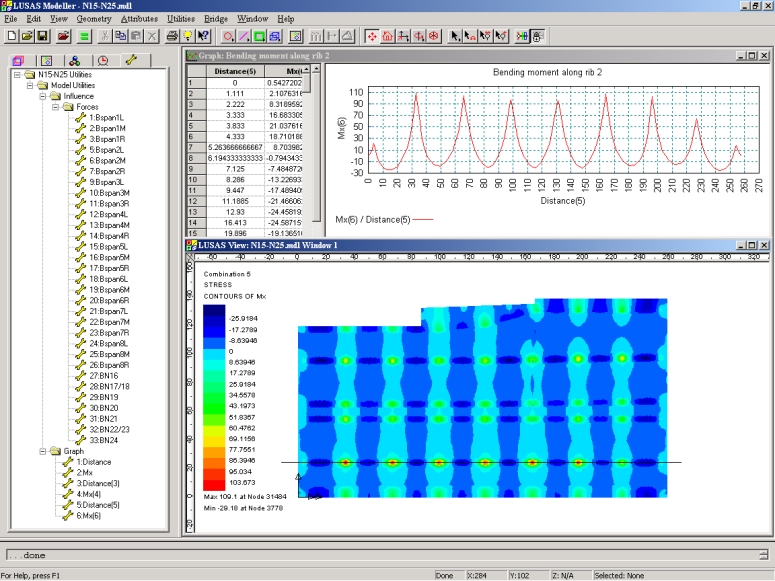
Phase 2 Design Alfred Benesch & Company is responsible for the design of about 1800 feet (550 metres) of the second phase of the project. The cross-section of this phase of reconstruction consists of three to five unequal continuous spans varying from 12 feet to 46.5 feet. Longitudinally, the structure typically spans 32 feet with some longer spans across the lower level street intersections. Typically, a 2 foot deep, 4 foot wide longitudinal rib runs along each column line. At some locations, the rib depth or width is increased depending on the spacing between the columns. The deck slab between the ribs is typically 13" thick and is post-tensioned in the transverse and longitudinal directions. This design concept requires an increased effort on the designer’s part in order to accommodate the post-tensioning tendons without conflict in both directions while maintaining the stresses in the deck. This issue is solved by banding the profiled tendons in ribs in the longitudinal direction with straight tendons in the slab between adjacent ribs. Banding of the profiled tendons allows for providing uniformly distributed profiled tendons in the transverse direction. In this manner, the deck acts as a one-way slab in the transverse direction supported by the prestressed concrete beams formed by the ribs and the banded tendons. Modelling challenges The geometry of the deck, and the adopted design concept presents some unique modelling and analysis challenges. The lack of uniformity in the spacing of the columns supporting the deck adds to the modelling complexity for live load cases. In addition to traffic loading, there will be heavy planters on the roadway dividers and pavements that also require modelling. Since the Chicago Department of Transportation had instructed that planters could be positioned anywhere within the roadway dividers and sidewalk, the planters are modelled as live loads to determine their maximum effects on the deck. Modelling and Analysis The 1800 foot long viaduct structure is comprised of 9 sections with expansion joints between each. As a result a separate LUSAS finite element model is being created for each section. The geometry of the deck is modelled using 3D shell elements, which enable the definition of different thicknesses for the slab and the ribs as well as the defining of an eccentricity for offsetting the bending planes of the two geometries. In order to model the bearing supports on columns, spring stiffness supports are being used at 4 points along the perimeter to define the bearing area. Doing this smoothes out the peak negative moments over the columns and results in an average 25 percent reduction in value compared to using one-point supports. Post-tensioning is modelled by applying equivalent loads that account for prestress losses. These loads are generated using spreadsheet macros that automatically analyze the post-tensioning forces in profiled tendons. Several static analyses are carried out on each section for dead and live loadings.
Vehicle Load Optimisation The Vehicle Load Optimisation facility in LUSAS helps significantly in speeding-up the determination of the design live load moments in accordance with the AASHTO Standard specifications. Using this facility, vehicle and other live loading patterns are determined from influence analyses performed for selected critical locations, and live load design moment envelopes are then generated. These analyses have illustrated that using a standard AASHTO HS20 Truck on all three lanes produces the controlling load for the structural configuration of the viaduct. The benefits of using the LUSAS Vehicle Load Optimisation facility were readily acknowledged. As Project Engineer, Dr Ihab Darwish, said: �Using the LUSAS Vehicle Load Optimization facility expedited the live load analyses for a highly repetitive task that would have otherwise been extremely time consuming.�
"Using the LUSAS Vehicle Load Optimization facility expedited the live load analyses for a highly repetitive task that would have otherwise been extremely time consuming." Dr Ihab Darwish, Project Engineer, Alfred Benesch and Company Find out more
Other LUSAS Bridge case studies:
|
|
Software Information
|
||||||||||
|